


Media channels offer widely variable returns. Here's how

Opinion
In turbulent times, businesses become more risk averse. So it’s a good moment to look at how different media channels offer hugely variable returns, explains Thinkbox’s director of research and planning.
Everyone’s worried about the economic outlook, and advertisers are no different. They want visibility and reassurance that their media investments will deliver. Rolling the dice might be an option during the very best of times. In these worst of times we want the safest bets possible.
Although guarantees aren’t available, guidance is. It’s in this context that we have just overhauled and updated the vast econometric data that sits behind the Media Mix Navigator, Thinkbox’s free media mix allocation tool.
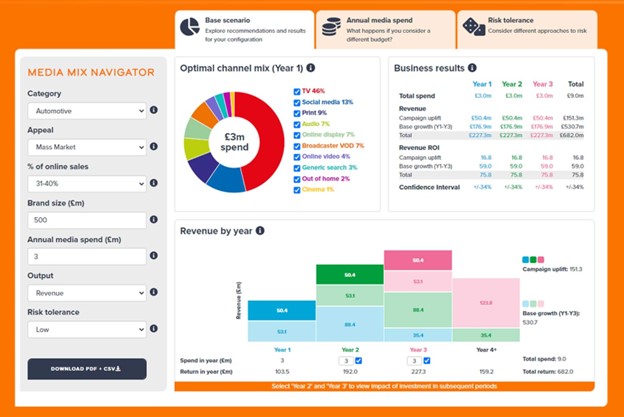
The tool gives an idea of the optimal media plan and the likely return you should expect given the context of your specific business. It’s designed for those without their own econometric analysis, or as a benchmarking device for those with.
It was first launched in 2019 (then called the Demand Generator). But a lot has happened since then, and it needed to be brought bang up to date. It now covers 2018 to 2021, with econometric data from Mediacom, Wavemaker, Gain Theory, and Mindshare for 52 brands across 14 product categories and 10 media channels collectively representing some £2.2bn in adspend.
So what does the new data tell us? Three main things…
Some changes in short-term ROI
Due to the slight differences between the make-up of the brands included within the databank we used back in 2019 and the one in play now, precise comparisons aren’t possible. Small movements in effectiveness should be interpreted as sample effects rather than effectiveness shifts. But the data does give a steer on any significant changes in short-term effectiveness.
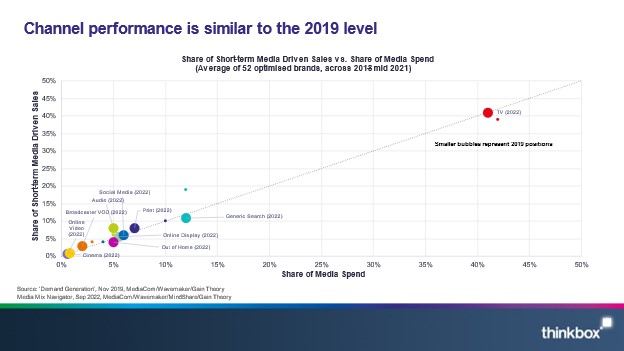
The first impression is that all channels tend to perform along the equilibrium of percent of spend and percent of short-term sales. But remember this is a databank of brands that use econometric modelling to help them optimise their spend, so it’s unsurprising that the channels are being ‘maxed out’. Over time the econometric models have helped the advertisers to find the optimum levels of investment in each channel to drive the maximum total return.
The principle finding when comparing channel performance for the 2018-21 databank with the 2016-19 databank is that, despite shifts in media consumption, there is very little movement in the relative media performance for short-term return (the bigger dots compared with the little ones).
Linear TV remains top right by some distance, accounting for 41% of return from 41% of spend. Audio, online display, out-of-home (OOH), and broadcast video-on-demand (BVOD) remain pretty static in terms of short-term effectiveness.
The only three notable movers across the two periods are search, print and social media advertising.
Previously, search was highly efficient, generating 19% of return from 12% of spend. However, due to inflation in pay-per-click (PPC) search cost the efficiency of search has dropped to a more comparable level with the other channels (11% of return from 12% of spend).
Spend on print advertising has dropped between the two periods down from 10% to 7%, but percentage of sales has only declined from 10% to 8%, moving it up the efficiency curve. Social advertising has increased in percent of budget from 4% to 6%, with percent of sales following suit.
In terms of short-term return on investment (ROI), audio is the one channel that looks under-invested in, accounting for 8% of sales from only 5% of spend.
There are safer waters to swim in
The two measures that financial teams care about the most when assessing a potential investment are return and risk. As we navigate uncertain times, the focus on the risk of any given investment will increase.
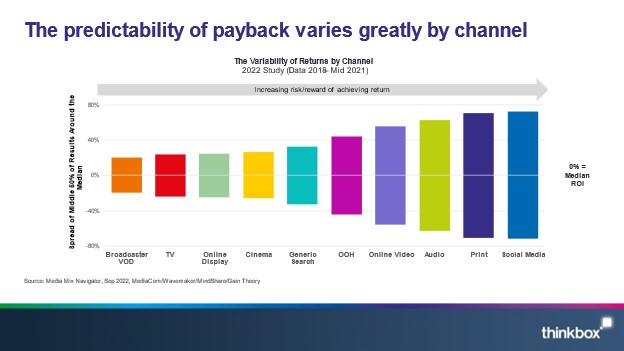
This chart displays the latest data on the variability of returns by channel. Low variability means that this channel is more likely to return a predictable ROI (less risky), whist high ROI variability means the opposite (riskier).
It’s worth noting that high variability works both ways: there’s the possibility of achieving a much higher than average ROI, as well as a much lower one. Using this data can help planners and CMOs discuss their attitudes to risk for a given media plan and adjust accordingly.
So the question is what matters more: higher confidence in a certain result, or the potential for a higher return with the risk it may backfire?
Effectiveness is transformed when we include sustained effects
The Media Mix Navigator now has a higher granularity of data available on how long-term effects differ by product category.
The new data shows that automotive campaigns have the highest sustained effects (unsurprisingly). On average the long-term multiplier for an automotive brand is 2.58 (i.e. if your short-term return — 0-3 months post campaign — is £1m then during the subsequent 2.75 years, this campaign will generate a further £2.58m in sales).
Online retail also delivers a high long-term multiplier of 1.63, telecoms is next at 1.40, finance follows with 1.24, then retail at 1.21, with FMCG having the lowest multiplier at 0.88.
If these substantial sustained effects are considered when assessing channel performance it changes the picture.
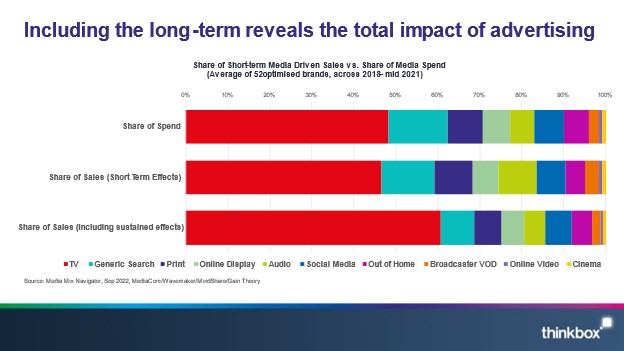
Because TV, by some way, has the highest long-term multiplier, across the entire dataset it produces by far the biggest increase in total returns, accounting for 61% of all sales with its 48% of spend.
Generic search shrinks, accounting for 8% of total returns for 14% of spend.
Audio, which looked under-invested in when looked at in the short-term looks more like it gets the right level of investment when its sustained impact is included.
***
So the new databank behind the updated Media Mix Navigator and the guidance it provides hopefully offer advertisers some reassurance as we head towards 2023. It will help them make the evidence-based business case for continued investment in advertising, and how to mitigate risk, while costs come under even greater scrutiny.
Matt Hill is director of research and planning at Thinkbox, the marketing body for commercial TV in the UK.
Strategy Leaders is our commitment to showcase the media industry’s most important strategy issues and debates, as well as focus on notable ad campaigns and from a media-planning lens.
Sign up for our daily newsletter and receive Strategy Leaders every Thursday.