


TV sector spend for 2020

All forms of advertising were blown off course by the events of 2020. Entire business sectors and some media were shut down. Advertisers understandably deferred or cancelled spend as they grappled with unique new challenges. The TV broadcasters reacted nimbly – and some advertisers even took advantage of the situation. Thinkbox’s Matt Hill looks at what trends emerged in TV.
TV advertising revenues fell by around 50% in Q2 2020, but recovered to finish the year with a 12% annual decline (£4.35 billion, based on figures provided by the broadcasters).
That goes down as a decent performance, all things considered.
I suspect when the revenue figures come out for all ad media, TV will have been one of the least-worst performers. Not much to cheer about though when some media – cinema and outdoor – were effectively cancelled.
While the headline figure for TV investment is of interest and tells a relatively positive story of gradual recovery, things get more interesting if you dig beneath the surface.
Beneath the headline TV investment figure are stories that show how TV was used by different business sectors, and how its use changed through the course of the year.
To tell these stories, I’m going to go a bit ‘Sorrell’ and throw some shapes – L, V and J to be specific.
I’m also going to use a colour-coded chart that shows you the shape of the year’s TV investment by category month by month – blue shows a year-on-year rise in TV spend, red a fall.
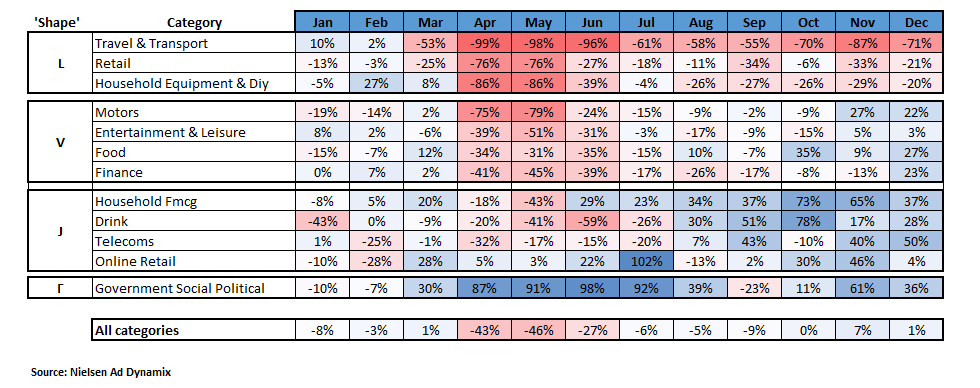
First the L-shaped categories, those that were hit badly by circumstances and stayed hit. Travel was obviously the definitive L.
After a positive start to the year, travel companies clearly saw the danger in March when spend dropped by 53%. From there, despite a slight recovery in late summer, the story was bleak with spend severely diminished. In total, the Travel sector – from travel aggregators to airlines – reduced linear TV spend by £137 million year-on-year.
It was also an L-shaped story for Retail and for Household Equipment/DIY – which were forced to close for much of the year.
Together they accounted for a combined decline of £142 million. Despite coming back to positive year on year spend in October, both categories dropped back to annual declines as lockdown hit again in November. Home furnishing stores were particularly impacted as both the first and second lockdowns occurred during peak season.
Next, we have the V-shaped categories – the ones that bounced back.
Motors saw an 80% drop in spend in April/May before stabilising in July to October and returning to growth, at the end of the year.
There were some interesting variations here with Volvo, MG, and Kia all taking the opportunity of lowered TV pricing to increase their TV spend. Ford on the other hand dropped its spend by around £10 million.
Entertainment & Leisure is a very diverse advertising category, encompassing fast food restaurants alongside film distributors, subscription streaming services and gambling businesses. So, it is difficult to draw much meaning here.
But, as a category, the worst of the impact seemed to happen in Q2 with normality returning in the second half of the year. McDonald’s, for example, reduced Q2 spend by £12 million but marginally increased it in Q4.
Likewise Food: well established food businesses like Walkers, Nestle, Mars, Heinz, Danone, Birds Eye & Kellogg’s reduced spend by a combined total of £14 million in Q2. But, by Q4 had returned to growth (up £6 million year on year).
Supermarkets meanwhile increased their TV spend across the year as a whole, up £9 million collectively. Aldi (pictured above) led the charge, investing £31 million in TV across the year (up £4 million on 2019) and took a 24% share of voice out of the big six. Binet and Field would be proud.
Finally, there were some J-shaped categories – last year was a pandemic, not a recession, and some businesses were able to seize the growth opportunity at hand.
FMCG was a standout J. Our need for everyday essentials remained unchecked and with rock bottom TV prices it was a great time to invest in your brand – if you could.
Many FMCG advertisers (mainly Household) increased their TV investment overall compared with 2019.
Unilever led the way, spending £65 million more on linear TV advertising than they did in 2019 (a 130% increase). This bought them 16 billion more ad views in 2020 compared with 2019.
With e-commerce booming in lockdown and TV increasingly recognised as the sector’s greatest shop window, online retailers barely paused in 2020. Most months saw a year on year increase in TV spend.
The market for online resellers was clearly accelerated in lockdown, with ebay, Schpock and musicMagpie collectively increasing TV spend by £17 million year-on-year.
2020 also saw a surge of new to TV e-commerce businesses, the biggest spender being Cazoo, which totalled £15 million in its first year on TV.
A final word about a sector that belongs in a category of its own and doesn’t handily correlate with a letter of the alphabet – unless we invert an L maybe.
Government / Social / Political TV spend soared in Q2 and stayed soared for the rest of the year (save a blip in September when perhaps they were being a bit over-optimistic).
So, the story of TV advertising spend is a lens through which the story of 2020 can be viewed.
TV investment undoubtedly benefited from the closure of cinemas and the challenges lockdown posed for outdoor. But TV also proved its worth in the pandemic for many sectors – and proved an opportunity for those who were able to invest.
Fingers crossed that in 2021, all sectors become r-shaped as we push towards recovery.